One slow disk, one frozen assistant: Hermes moved three door-blocking jobs to the background
It is 2am, your Hermes gateway runs on the NAS, and the backup just started. You send it “you there?” from your phone and watch the spinner. Nothing. You assume the model is slow — but the machine is busy writing to disk, and every session status update on that box has to wait behind the previous block. The same thing happens on your laptop: the desktop app is still open, the fans are on, and one CPU core is pinned in Activity Monitor. That is an idle poll probing twice a second.
Both stalls share one cause: work that belongs in the background was sitting in the doorway. A batch of changes merged on 18-20 September (#117206, #117063, #117066, #117201, #117041, #116967) deals with those doorways, and the fix is the same every time: read paths stay local, writes move to a background thread, polls run on a cadence instead of on every loop iteration.
One status write froze every inbound message
write_runtime_status() writes the gateway’s runtime state into gateway/runtime_status.json with a read-merge-write. That sounds cheap, but it ran synchronously on the event loop, twice per turn plus once on every adapter state transition.
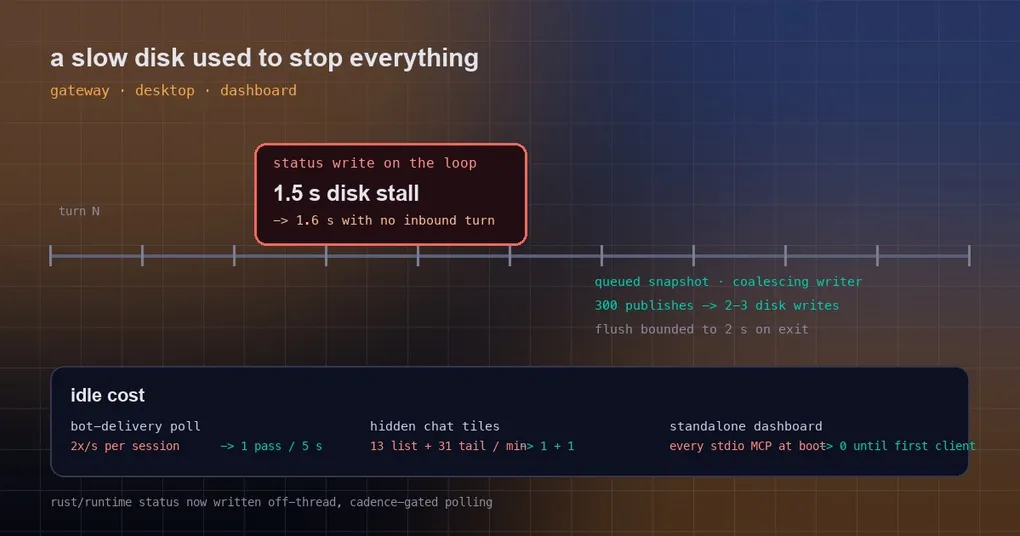
On a slow or contended disk those three steps pin the whole loop. The probe in PR #117206 is blunt: a 1.5 s disk stall produced a 1.6 s loop stall — and for those 1.6 seconds every inbound message, including that “you there?” from your phone, sits in a queue.
The fix splits the write out entirely:
- status updates publish to an in-memory snapshot (
publish_runtime_status()), never touching the disk on the hot path; - one coalescing writer thread (
_RuntimeStatusWriter) owns the file and folds a burst of updates into few writes — measured at 300 publishes collapsing to 2-3 disk writes; - call sites that genuinely need the bytes on disk (startup, shutdown) use a bounded wait (
wait_timeout), and the terminal stamp at exit gets a 2 s budget instead of blocking forever.
One behaviour worth knowing: the writer re-reads the file immediately before each write and lays its snapshot over the result, so fields written by other processes are not clobbered (think hermes gateway migrate --standalone, or a container seeding desired_state at boot). The trade-off is the flip side of a bounded wait: if the disk is wedged at exit, the “stopped” stamp can be stale on the next boot rather than the exit hanging.
The desktop app: two probes a second, and hidden tiles that kept polling
hermes serve (the backend behind the desktop app and TUI) runs a bot-delivery poll. Its loop’s only blocking point is completion_queue.get(timeout=0.5) — meaning every loop iteration ran a delivery probe: twice a second, per session. Each probe walked every lease in active_sessions.json and called psutil to check whether the process was alive.
The cost is sessions × leases × 2/s. The reporter’s numbers: 11 sessions, 8 leases, 88 probes per round at 102% of one CPU core.
PR #117063 puts the delivery poll on the same 5 s cadence as the /loop, /heartbeat and kanban polls, and short-circuits entirely when a lease belongs to the current process — no psutil probe on yourself. Probes went from 10 per 5 s to 1, and psutil calls for self-owned leases from roughly 80 to zero. The short-circuit deliberately keeps the (pid, process start time) identity comparison: otherwise a recycled PID that happens to equal yours could keep a stale lease alive forever.
Same batch, same family: hidden keep-alive chat tiles kept polling subagent.list every 5 s and subagent.tail every 2 s per active subagent. Their only guard was document.visibilityState — and the whole window is visible; tabs are hidden with visibility: hidden, layout preserved. So the guard was always true. PR #117066 gates both pollers on the pane-visibility context and re-arms them on reveal. Per hidden tile per minute, that is “13 list + 31 tail” calls down to “1 + 1”.
hermes dashboard: no MCP spawn storm on boot, no frozen UI on a big database
Two more stalls live in hermes dashboard.
Warm-up at boot. A standalone hermes dashboard used to kick off background MCP discovery immediately — spawning every configured stdio MCP server even if nobody ever opened the UI. The reporter traced it through mcp-stderr.log write churn, which shows up badly on NAS/ZFS storage. PR #117201 arms the discovery instead and fires it on the first /api/ws client (or pulls it forward at the first agent build). A Desktop-spawned dashboard keeps its eager start, so nothing changes there.
A large state.db blocking everything. GET /api/sessions/search, /api/sessions/stats and /api/sessions/{id} opened SQLite directly inside async def handlers. Once the session database reaches a few hundred megabytes, the FTS5 query blocks the event loop for seconds — the symptom is a frozen sidebar and WebSocket wake timeouts. PR #117041 routes those three handlers’ database work through asyncio.to_thread, matching the sibling handlers in the same module. Before/after: SQLite opens on the loop thread across the three routes went from 3 of 4 to 0 of 4.
If your session database is already large, there is a separate offline pass you can run today: hermes sessions optimize-storage (with every holder stopped) rebuilds the FTS index. That path came from the earlier #65798, not from this batch.
“Database is locked” — now the log names the process holding it
Some waits are benign. A write lock held by someone else is not. Every Hermes process has state.db open, so scanning open descriptors cannot tell the one writer from the readers — the 60-second timeout message could only name the victim (database is locked (another Hermes process held the state.db write lock for over 60s)), and you had no idea which process to go kill.
PR #116967 reads /proc/locks for the database, its -wal and -shm inodes just before raising, keeps write-class locks, decodes SQLite’s byte offsets (on -shm, 120 is a WAL write, 121 a checkpoint, 122 a recover, 123-127 read slots; a pending byte on the main file means PENDING/RESERVED/SHARED) and attributes the holder to a PID. The new log line:
WARNING hermes_state_lockowners: state.db write lock unavailable for 60s (state.db):
PID 594094 (hermes --worktree --yolo) holds WAL write lock on state.db-shm
Two limits to keep in mind: this is Linux only (it reads /proc/locks), and OFD locks do not export a PID, so the log says so instead of guessing. The holder’s command line goes to the log, not into the exception text — errors are bucketed by phrase, and a worktree named fix-corrupt-db would flip the bucket.
If you hit lock contention regularly, the state.db corruption self-heal and WAL write guard write-ups cover the retry budgets and the repair flow.
Updates stopped doing one useless pass
One more from the same batch, because it is very tangible: hermes update used to re-run npm ci whenever web-UI or desktop sources changed, extracting node_modules twice over. PR #117110 gates those two installs on the same manifests digest that already gated the first pass (plus an Electron-presence check for the desktop pass). The reporter’s scenario — three npm passes, 117 seconds — now skips two of them when the lockfile is unchanged.
Is any of this available yet?
Honestly: no. Every change above merged on 18-20 September 2026, and the newest release is v0.21.3 (tag v2026.9.14). These live on main and are in no release yet — hermes update still gives you the old behaviour. You can wait for the next release, or build from main yourself. To see which code path you are on today:
hermes --version                          # which release you are running
hermes sessions optimize-storage          # offline FTS rebuild for a large state.db
The pattern
Read the six changes together and they treat one disease: I/O on the critical path. A status write, a process probe, a boot-time warm-up, a SQLite query, an npm install — each looks harmless alone, but anything that stands between Hermes and “handle the next message” reads to the user as “Hermes is slow”. A quick test for any background task you are about to leave on the main loop: does it need the network or a disk? Does it wait on anything it does not have to? Could it run on a cadence instead? One “yes” and it belongs in the background.
If what annoys you is the read-side stall — a picker that spins, a list that hangs — that story is in the read-path cache post; for the desktop’s live view of running children, see steering subagents mid-flight.