190 wasted calls and no guard said a word
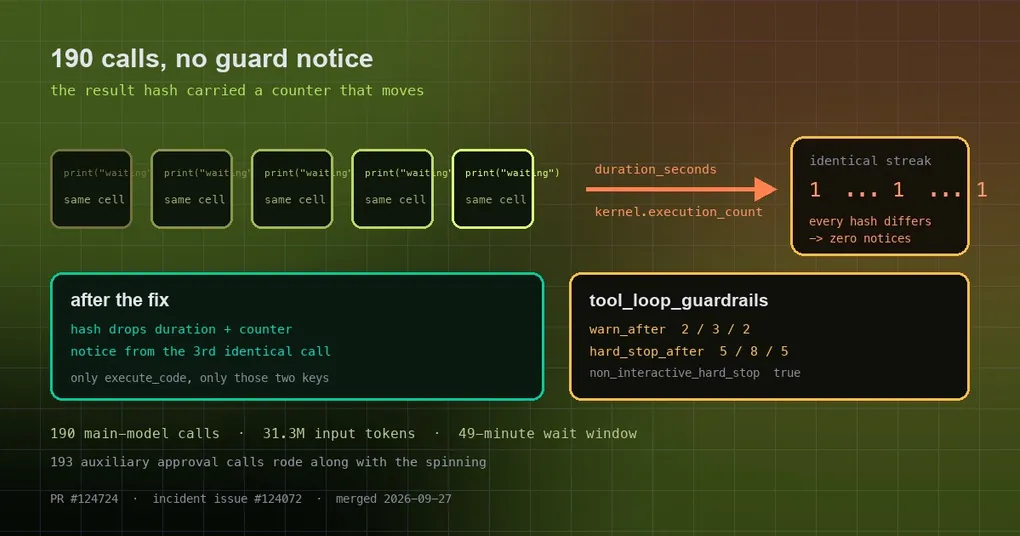
You ask the agent to spin up 10 background subagents and summarise when they are done. Instead of ending the turn and waiting for the notification, it keeps the turn alive with one no-op after another — execute_code calls that print something and change nothing. 84 minutes later you abort by hand. Reading the log afterwards, there is not a single “you appear to be repeating yourself” notice. The guard was silent the whole way.
That is not a model being dumb. It is a loop detector that could not see this particular kind of spinning. Issue #124072 quantified the whole incident, and PR #124724, merged 2026-09-27, fixed the key part of it.
The incident ledger: 84 minutes, 190 calls
The numbers in the issue come from the session’s own records (the loop window, 22:31:05–23:20:12):
| Metric | Value |
|---|---|
| Main-model API calls | 190 |
| Input tokens (incl. cached) | 31,365,131 (of which 31,272,448 were cache reads) |
| Output tokens | 25,896 |
| Sum of per-call latency | 1,869.8 s — 63% of that 49-minute window |
| Auxiliary approval-model calls | 193 (roughly one per wasted iteration) |
The whole session (22:09–23:33) is even clearer on the main row: 267 calls, 40,377,600 cache-read tokens, 73,059 output tokens. In other words, 71% of the main-model calls were spent inside the wait window, and the guard never fired once.
Why loop detection stayed quiet
Hermes’ repeated-call guard keys on a triple: (tool name, arguments, result hash). Identical calls have to line up as a streak before the “Nth identical call” warning (or hard stop) can happen.
The problem was the result hash itself:
execute_coderesults carry two per-call bookkeeping fields that change every single time:duration_seconds(wall-clock) andkernel.execution_count(a monotonic kernel cell counter).- Byte-identical replays therefore hashed differently every time, and the identical-call streak stayed at 1.
- The second half of the problem is the sharper one:
after_call()returns early for mutating tools, andexecute_codeis one — so for this tool only that one guard path can ever fire. Together: zero notices. The code comment records “a model re-ran one empty execute_code call 147 times unflagged”; the PR body records zero notices across 186 calls in the incident.
The fix: drop exactly those two fields, for execute_code only
The patch is deliberately narrow:
def _without_execute_code_metadata(parsed):
    if not isinstance(parsed, dict):
        return parsed
    cleaned = {k: v for k, v in parsed.items() if k != "duration_seconds"}
    kernel = cleaned.get("kernel")
    if isinstance(kernel, dict):
        cleaned["kernel"] = {k: v for k, v in kernel.items() if k != "execution_count"}
    return cleaned
The comment explains the scope: for any other tool those same key names can be real output, so touching them would corrupt “identical” comparisons; non-JSON results hash exactly as before. With the change, replay detection works again — a notice appears from the 3rd identical call onward (the exact thresholds are configurable, below).
Worth being precise: issue #124072 lists four defects. This PR fixes one of them — volatile fields blinding the replay detectors. The other three, including the mechanics of waiting on background subagents, are out of scope here.
The knobs you already have
These behaviours are configurable, and the defaults differ between interactive and unattended runs:
# ~/.hermes/config.yaml
tool_loop_guardrails:
  warnings_enabled: true
  hard_stop_enabled: false                  # interactive sessions warn by default
  non_interactive_hard_stop_enabled: true   # gateway / cron stop hard by default
  warn_after:
    exact_failure: 2
    same_tool_failure: 3
    idempotent_no_progress: 2
  hard_stop_after:
    exact_failure: 5
    same_tool_failure: 8
    idempotent_no_progress: 5
  loop_caps:
    max_web_searches: 50    # web_search calls per turn
    max_subagents: 50       # subagents spawned per turn
The reasoning is easy to follow: nobody can press /stop on an unattended run, so those platforms hard-stop by default, while interactive sessions get a warning first so the model can rescue itself. loop_caps are per-turn ceilings that reset every turn and apply regardless of the thresholds above — dozens of searches or subagents in a single turn was already pathological.
To inspect the effective values, hermes config get tool_loop_guardrails works; the subcommands are show|edit|get|set|unset|path|env-path|check|migrate (there is no reload).
What this means if you run long tasks
- Do not wait by spinning. Let the turn end and come back on the background notification. It is dramatically cheaper than keeping a turn alive with empty probes — this one burned 31M cache-read tokens.
- The loop costs more than one model. Those 193 auxiliary approval-model calls line up almost one-for-one with the wasted iterations; you pay twice.
- Hard stops are not a safety net for everything. Even working correctly, this guard only catches identical calls. A model that rephrases each empty call escapes it, and the per-turn ceilings are all that remain. For the adjacent machinery, see live subagent control and what happens when the turn cap is lifted.
- The full meaning of these keys is in our hermes config reference.
Release status
PR #124724 merged on 2026-09-27, after the v0.21.5 release tag (v2026.9.24), so it is on main only: hermes update will pick it up.
The takeaway
A timestamp that changes on every call is normally just noise. It only becomes expensive when it is used to decide whether this call was the same as the last one — at which point the guard goes blind across the whole tool. The fix does not add another guard; it makes the hash look only at the part of the result that actually represents what happened. A few dozen lines, in exchange for stopping most of those 190 calls much earlier.