Status Bar Upgrade: Cache-Hit Rate, Latency, and Tokens/sec at a Glance
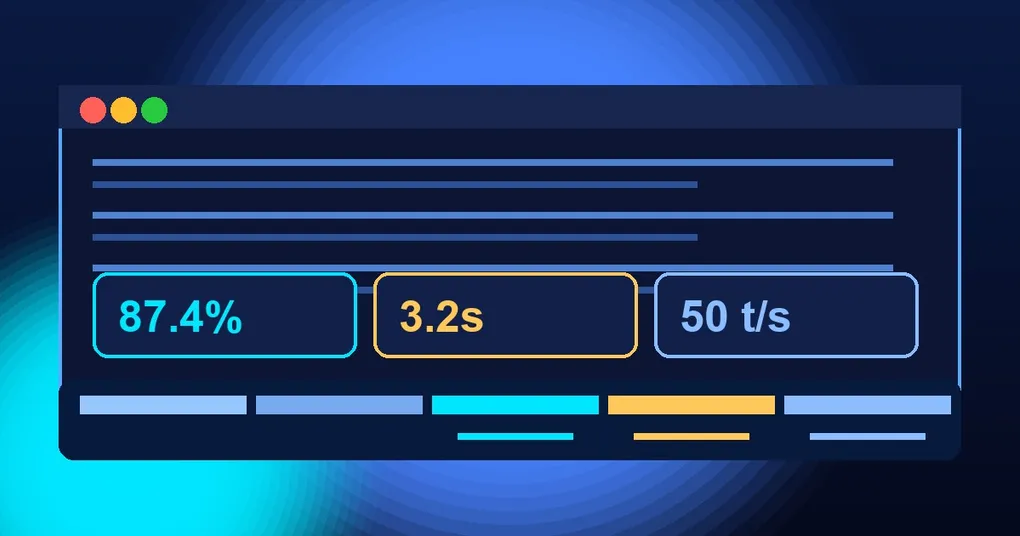
You stare at the status bar at the bottom of your terminal: model name, context percentage, a compression icon. Plenty of information — but what you actually want to know is “is this model fast right now? Is my cache hitting? How many tokens per second is it producing?” — because the cache-hit rate decides whether your API bill is a tenth of the price or full fare. An update merged on August 30 (PR #98250) puts all three answers straight into the status bar: cache-hit rate (◎), rolling average latency (◷), and output tokens per second (↑) — and every field can be toggled on and off via config.
What’s new in the bar
On a wide terminal, the updated bar looks like this:
⚕ model │ 3% │ ◎ 87.4% │ ◷ 3.2s │ ↑ 50 t/s │ 2mLeft to right: model name, context at 3%, cache-hit rate 87.4%, average latency 3.2s, 50 output tokens/sec, session duration 2 minutes. The three new metrics are rolling statistics — latency and throughput take the moving average of the last ~10 API calls rather than a lifetime average since startup, so they reflect the current state of the model.
A few thoughtful details:
- The cache-hit rate resets its baseline on model switches and context compression — it reflects the current cache regime, not a number diluted by history;
- When no cache reads exist at all, the field hides instead of showing an alarming 0% — no misleading signals;
- Negative or NaN latency is guarded — one jittery call can’t pollute the stats.
Field toggles: display.status_bar.fields
The new metrics are not forced on you — every field can be enabled or disabled independently. The config key is display.status_bar.fields; an empty list means “all default fields”:
display:
  status_bar:
    fields: []   # empty = built-in defaults (all fields)
Say you only care about cache and speed — keep just these:
display:
  status_bar:
    fields: [model, ctx, cache_hit, latency, tps]
Your bar becomes ⚕ model │ 3% │ ◎ 87.4% │ ◷ 3.2s │ ↑ 50 t/s. Against the source (hermes_cli/config_defaults.py), the full field list is: cache_hit, latency, tps, compressions, bg_tasks, bg_processes, bg_subagents, goal, duration, prompt_elapsed, idle_since, focus, yolo, stash, battery, title, total_tokens. Two caveats:
total_tokens(session-sum tokens) is opt-in only — it never shows unless you list it;- Narrow terminals drop wide-mode-only fields (
context_detail,prompt_elapsed,idle_since) regardless of config.
Why the cache-hit rate is worth watching
This is the most “valuable” of the three new metrics. Major API providers (Anthropic, OpenAI, DeepSeek, and others) typically charge prompt-cache reads at 1/10 the normal input price or less. The status bar’s hit rate is a live dashboard for your cost-saving strategy: if it stays low for a long time, your session structure keeps churning (system prompt changing often, unstable tool descriptions) so the cache keeps missing; if it’s consistently above 80%, your money is being spent where it counts.
How to get it
PR #98250 merged on August 30, 2026 and is on main only — v0.20.6 does not have it. Update to latest main and the new fields appear in plain hermes; to tune them, edit display.status_bar.fields via hermes config edit.
The status bar is the CLI’s dashboard, and these new metrics turn it from decoration into operating data. For the full token-and-cache savings playbook, pair this with the 5 free search channels guide and the context token optimization guide; more hidden CLI efficiency wins are in the command palette guide.